2018q2
Regional eXplorer (ReX) Update, 2nd Quarter of 2018
Welcome to the second update for 2018. Regional eXplorer is a consolidated platform of integrated databases that provide accurate and up-to-date statistics down to the local municipal level for South Africa. As an industry leader, our clients use our data in a variety of ways to inform their decision making and require ReX to be constantly updated with the latest data. We strive to provide these data updates in a consolidated manner on a quarterly basis.
Main data releases incorporated in this update
ReX has been updated with the latest data available from StatsSA (incl. GHS, QLFS and GDP), SARB, SARS and many other data sources. Topics that are heavily dependent on information from the General Household Survey (for example the Household Infrastructure module) has been updated to include 2017 figures that has not been available previously.
Regional Perspectives: Global Outlook
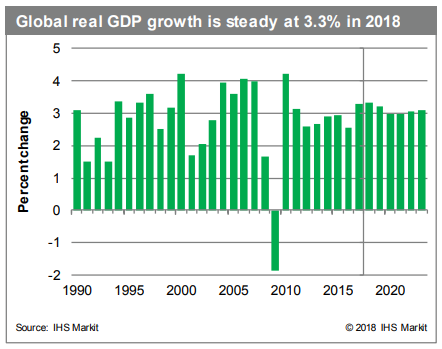
The global economy: Steady growth amid gathering storm clouds
World real GDP growth is projected to hold steady at 3.3% this year before easing to 3.2% in 2019 and 3.0% in 2020. In 2018, an upward revision in the US forecast is offset by weaker outlooks for the Eurozone, United Kingdom, Japan, Brazil, Canada, and India. The steadiness in growth belies the possible impact of gathering storm clouds. First, the increasingly belligerent trade stance of the United States could trigger a damaging trade war. Second, higher oil prices will erode growth—although at current levels the impact will be limited. Third, rising political risks in Europe (especially in Italy and Spain) could hurt growth prospects. Finally, increasing financial pressure on key emerging markets (including Argentina, Brazil, South Africa, and Turkey) is darkening the outlook. None of these looks like a recession trigger—yet.
Regional Perspectives: South African Near-term Outlook

IHS Markit expects GDP growth to recover to an estimated 1.6% in 2018, underpinned by lower inflation and interest rates and a favorable global backdrop.
The South African economy is moving from one milepost to the next, with crucial political and fiscal outcomes supporting a mild GDP growth recovery and a strong rand exchange rate during 2018. The election of Cyril Ramaphosa as the new leader of the African National Congress (ANC) in December 2017 was soon followed by the resignation of Jacob Zuma as the president of South Africa on 14 February 2018. Cyril Ramaphosa was sworn in as the president of South Africa on 15 February, which boosted not only domestic, but also international investor sentiment. This was followed by the release of the 2018/19 national budget, presented by the incumbent finance minister at the time, Malusi Gigaba, on 23 February, outlining a fiscal program that will allow public-sector debt consolidation below the 60%-ofGDP threshold over the medium term. A cabinet reshuffle that occurred on 26 February aims to root out state mismanagement and corruption. These positive fiscal and political developments laid the foundation for an unchanged local-currency debt rating by Moody’s in March 2018, which supported investor sentiment even further. The rand exchange rate appreciated to ZAR11.55/USD1.00 by end-February, its best level in more than four years.
The favorable exchange rate trajectory is expected to mitigate the inflation impact of the 1% increase in the South African value-added tax (VAT) rate to 15% from 14% previously, announced in the 2018/19 national budget. Moreover, IHS Markit is of the view that South Africa’s headline inflation rate will remain within the South African Reserve Bank’s (SARB) target range of 3–6% during 2018–19, enabling a 50-basis-point cut in the policy rate during 2018. Low inflation, combined with lower interest rates, is expected to sustain real household income growth and consumer spending during 2018. Higher taxes and structural impediments, such as a high unemployment rate and a high level of household leveraging, will continue to curtail consumer growth.
Fixed investment spending is unlikely to show any significant rebound during 2018–19. Although business and consumer sentiment received a considerable boost following the recent political developments, a hike in effective tax rates for businesses and consumers is expected to curtail residential and nonresidential investment during 2018. A significant decline in public-sector investment funding in the 2018/19 budget underscores this expectation.
The stronger rand exchange rate is expected to lift import demand during 2018, while export growth could slow marginally from previous estimates. Limited upsides to international commodity prices and the stronger rand could nonetheless be counterbalanced by a favorable global demand backdrop, which is expected to keep overall export growth up from 2017.
Brief Overview and Review of Poverty Data in ReX:
A person is considered to be living in poverty if they live in a household where the total household income, divided by the number of people in the household, falls below one of Statistics South Africa’s (StatsSA) defined national poverty lines.
StatsSA makes use of three poverty lines; the food, lower and upper bound poverty lines which are defined based on different levels of consumption. For example, the food poverty line is based on the level of consumption below which individuals are unable to purchase sufficient food to provide them with an adequate diet.
The ReX Poverty Model inherits not only the definition of poverty from StatsSA but also the published poverty rates. In other words, outputs from the ReX Income model do not determine the national poverty rate but are used for geographically distributing the data.
The ReX Poverty Model is also estimated primarily from the outputs of three interlinked models; the income, household and demographic models. Income is used only for the purposes of spatially distributing poverty. The household and population outputs are used for driving the conversion from households to individuals. This component is at the heart of the poverty model, taking into account average household size, racial breakdown and income distribution of each region which - along with additional data from StatsSA’s income surveys - is used to convert households by income category into individuals by income category.
However, it is important to note that the driving constraint behind the poverty model is the official StatsSA poverty rates, to which the ReX model is balanced directly, ignoring any national level outputs from the ReX income model. With this release, users will notice some historical revisions on the poverty information found in ReX, where the poverty levels were adjusted slightly upward. This was triggered by a research report published by StatsSA which included a consistent methodology across time from various IES and LCS surveys between 2005/6 and 2014/15.
Best,
The IHS Markit ReX team