2023q2
Regional eXplorer (ReX) update – 2nd Quarter of 2023
S&P Global is glad to announce the 2nd quarter update for 2023 of Regional eXplorer (ReX) – the South African knowledge base of municipal-level insight. Each quarter, data from a vast number of sources are incorporated into the ReX database to provide users with the most up-to-date statistics. In this newsletter:
1. Rand exchange rate weakness is expected to subside during the 2nd half of 2023
2. South African Macroeconomic Outlook
4. New Data Extraction Layouts
Rand exchange rate weakness is expected to subside during the 2nd half of 2023
The rand has lost more than 6% of its value against the US dollar since May 4, leaving the currency at an all-time low of 19.37 rand/$1.00 on May 23. The rand furthermore has lost more than 3.5% of its value against the euro and the pound over the period. Few other emerging market currencies followed the rand’s trend, suggesting that idiosyncratic factors are primarily responsible for the recent rand slide. A widening current-account deficit, prospects of a widening fiscal deficit for 2023–24, and loss in investor interest following a political dispute between South Africa and the US underline recent rand weakness. Rand vulnerability is expected to remain elevated, with the currency only expected to make up some of its losses toward year-end. The rand is expected to end 2023 at around 17.80 to the US dollar.
South African Macroeconomic Outlook
South Africa is expected to avoid a technical recession during the first quarter of 2023. South Africa’s real GDP is expected to expand by a modest 0.3% quarter over quarter during the first quarter of 2023, allowing the country to avoid a technical recession. The growth performance has been restrained by severe electricity bottlenecks. The physical volume of electricity produced during the first quarter of 2023 fell by 1.6% quarter over quarter and 7.8% year over year. The electricity crisis is expected to worsen during the winter months of June and July. South Africa’s daily peak electricity consumption reaches 35 GW in winter from the summer average of 32 GW, triggered by the increased usage of electrical heating devices, geysers, and longer hours of light usage. This drives the likelihood of Stage 8 to Stage 10 load-shedding (an estimated loss of 8,000 MW-10,000 MW from the national grid) as well as a possibility of temporary total grid failure during the second quarter of 2023.
South Africa’s infrastructure bottlenecks go beyond electricity. Increasing incidences of water shortages will likely continue, affecting mining, agriculture, automobile, and energy sectors, all of which are heavy users of water. The closure of crude oil refineries has furthermore increased the reliance on refined fuel imports and South Africa’s vulnerability to global supply chain and export infrastructure disruption. The aviation, tourism, agriculture, mining, and energy sectors are all likely to be affected by fuel shortages.
Downside Risks. The government delays government spending rationalization programs, which include the public-sector wage bill and state-owned enterprise (SOE) inefficiencies. Public-sector debt levels escalate above current expectations, triggering further sovereign credit risk downgrades by international rating agencies, crowding out public investment, and deterring long-term growth prospects. “Populist” policies such as land redistribution disrupt the agricultural production supply chain and jeopardize property rights in the economy. Ongoing adverse weather conditions pose an additional threat to low food prices, hence risks raising inflation and lowering purchasing power. The impact of rising bond yields in the developed world results in a sharp swing in portfolio flows out of emerging markets, including South Africa. Such an outcome could mean higher inflation and interest rates than the baseline assumption.
Upside Risks. South African government may launch a series of reforms and policy actions to address the weaknesses in the education system, loss in international competitiveness, the mining charter, and the financial viability and leadership of SOEs. International commodity prices move above the baseline outlook; this improves the growth and exchange rate outlook in the South African economy. The government is partially successful in attracting $100 billion in local and foreign investments in the next five years. This includes electricity-generating investment in renewable programs such as solar, wind, and hydrogen.
Main data release incorporated in this update.
ReX has been updated with the latest data available from StatsSA, SARB, SARS and many more which allowed us to update ReX data to now include 2022 data on a sub-national level for all modules in ReX.
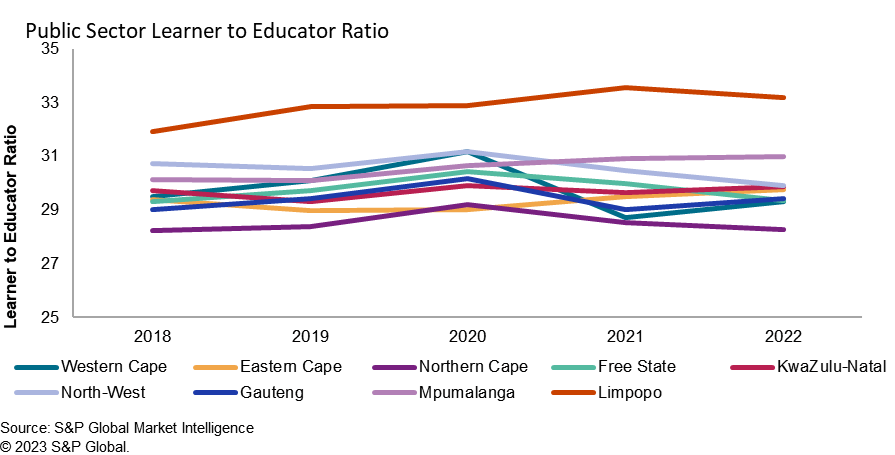
The Education Ratios under the Geographic Module have been updated with the 2022 EMIS data. The recommended Learner to Educator Ratio (LER) in South Africa in 30 learners per 1 educator. This ratio is an important aspect to consider when evaluating the education system as a link has been established between the LER and the number of people who drop out of school. Limpopo has the largest LER over 30:1 for the past five years. Meanwhile, both the Northern Cape and North-West provinces are on a steady decline.
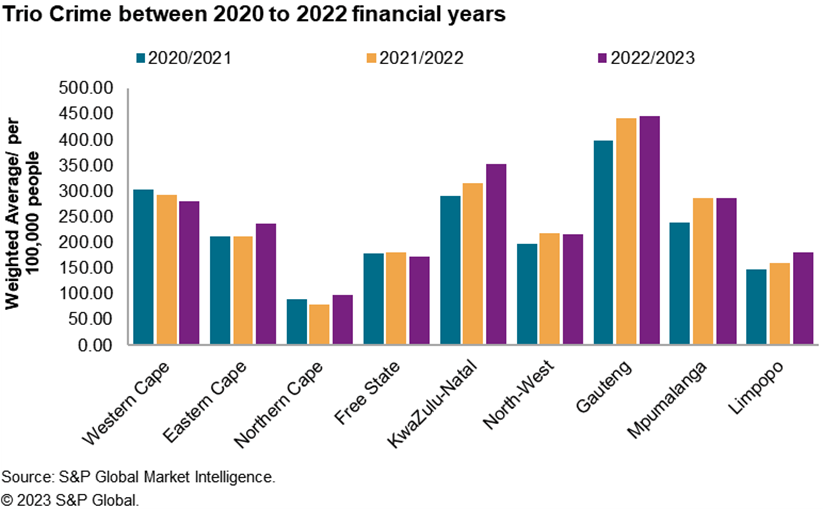
Under the Crime module, the variables have been updated to include the 2022 financial year crime statistics. Along with an additional year, a new quarter has been added to the quarterly crime variables. According to the 2014/2015 Victims of Crime Survey, Trio crime is perceived by households as the most commonly feared crime in South Africa. The Trio Crime index consists of Aggravated Robbery: carjacking, Aggravated Robbery: at residential premises, and Aggravated Robbery: at non-residential premises. All 9 provinces saw a drop in the average number of crime jackings in the first quarter of 2023 as well as robbery at both residential and non-residential premises. However, in the 2022/2023 FY almost all regions, except Western Cape and Free State, saw an increase in the Trio Crime index compared to the 2020 and 2021 FY.

However, in the 2022/2023 FY almost all regions, except Western Cape and Free State, saw an increase in the Trio Crime index compared to the 2020 and 2021 FY.
New Data Extraction Layouts
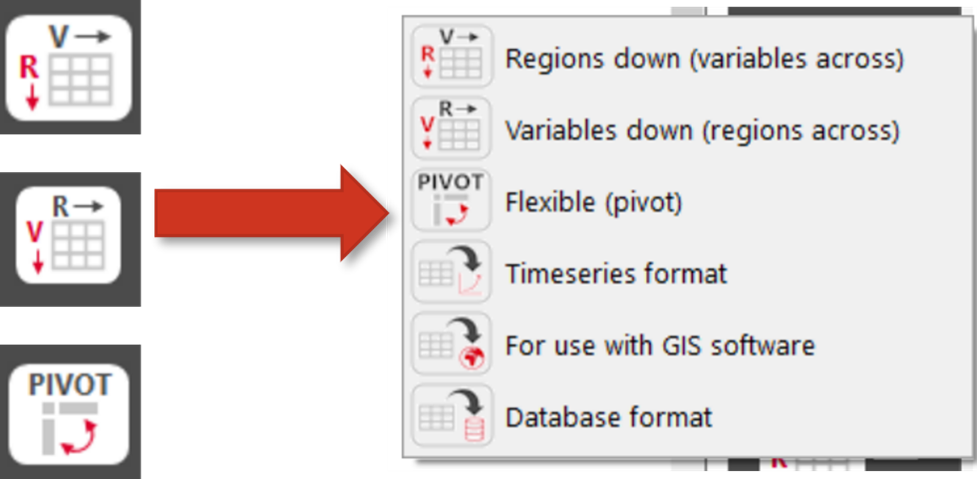
Over the course of the 2nd quarter, we have added three additional download outputs to Regional eXplorer. Previously, the three outputs were Regions Down, Variables Down, and Pivot and the three new additions are a Database format, Timeseries format and a GIS software format. An explanation of all 6 of the download options can be found in the info tab under Using ReX.
The Timeseries format displays the data in a wide format with each time selection represented in a separate column. If multiple dimensions are selected each dimension for a region is a row within the table. Each dimension has a description column (VarDesc), a region name, and a code column showing the breakdown of each row within the spreadsheet. This format can be used in determining trends within a dataset and patterns that may form over time.

Next, the database format is a long format, where each row is a point in time for each selected dimension per region. The output in the database sheet has three columns: RegCode, VarCode and Value. RegCode represents the region and VarCode is a unique code that represents the variable, dimension and time extracted for each region.
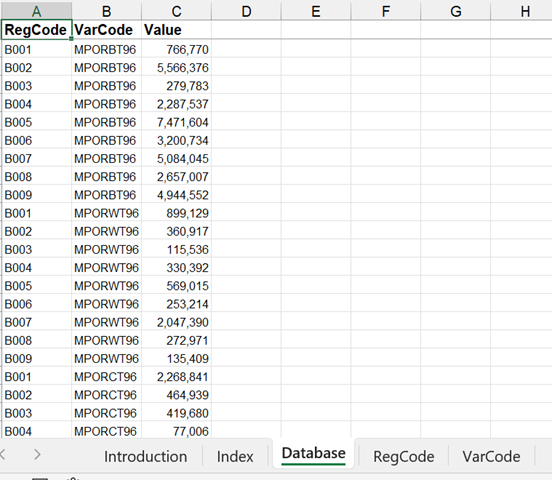
This output has an additional two sheets that serve as a dictionary for the RegCode and VarCode, each sheet provides an explanation of what the code signifies.

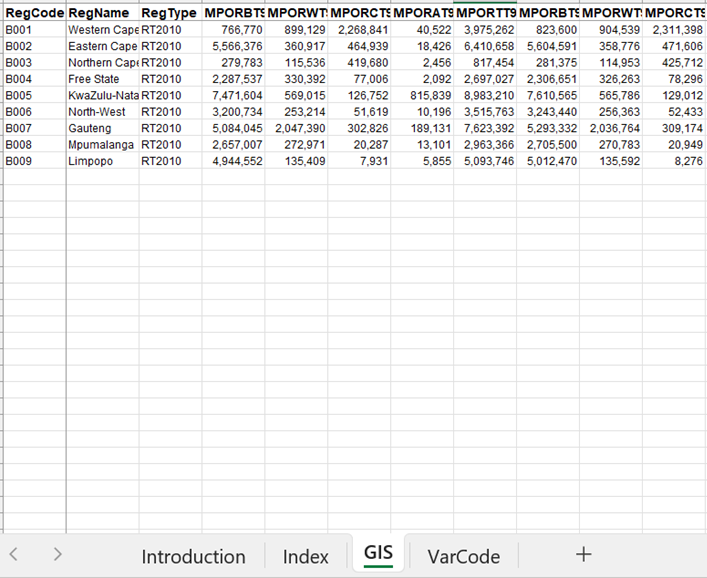
Finally, the GIS software format is where the data is displayed in a format that allows for linking the data, as an attribute table, to spatial layers. Using shapefiles provided by S&P Global’s ReX team, the output can be joined to the region shapefiles using the RegCode field. This type of output can be used in map production and spatial analysis. Similarly, to the database output, there is a VarCode sheet that explains the codes of the column names.
If you need instructions on how to link the GIS data to shapefiles, you can either:
1. Contact the ReX team for the instructions.
OR
2. In ReX navigate to the Info tab, select Using ReX and you will find the instructions under the Using a GIS and ReX data heading.
Later this year we anticipate a major update to the ReX data. The update will involve the inclusion of the latest Population Census that took place in South Africa over the course of 2022.
Enjoy the update!
The S&P Global ReX team